More Cool Infographics>>
Last week has been such a busy time for us at B2B Infographics when we had to deal with a huge amount of quality infographics and decide which is deserved a space on our site. Thanks God, everything is just OK now. Following are those in top 5 of the week from April 21 to April 27.
For more information about our standards of evaluation and other top 5, below links will show you the way:

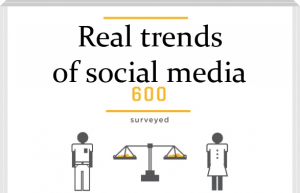
1. Google+ vs Facebook – A Guide to Your Brand Page Strategy

Compared to Facebook, Google+ is still young with about 2 years old. However, what Google+ has done so far is worth mentioning in the big world of social media. This infographic shows you detailed information about this two giant social media channels.
Which one do you prefer, Google+ vs Facebook?
For me, I have positive thoughts towards Google+, I don’t know, just personal feeling.
Our evaluation points
Core Message: 5/5
Data Visualization: 4.5/5
Graphic Design: 4.5/5
Total points: 14/15
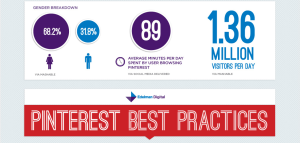
2. It’s All about Pinterest Marketing in US and UK

Considered to be the youngest sister (or brother) in the social media family, Pinterest has a new and innovative concept which proves to be very successful. I don’t know about you but I love the way we can share information on Pinterest, no need for too many words, just image is enough.
Have you leveraged Pinterest for your marketing campaign? Read this infographic to find out more about how US and UK businesses are using this interesting social platform.
Our evaluation points
Core Message: 4.5/5
Data Visualization: 4/5
Graphic Design: 4/5
Total points: 12.5/15
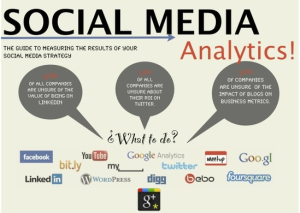
3. Why Small Businesses Should Use Social Media Technologies for all Business Needs
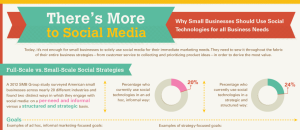
Like other businesses, you take advantages of social media in your marketing strategies. Have you ever wondered why you should use social media for this purpose? Is there any ways to improve what you are doing with social media? Find the answer in this infographic.
Our evaluation points
Core Message: 4/5
Data Visualization: 4/5
Graphic Design: 3.5/5
Total points: 11.5/15
4. 2013 Is the Year of Responsive Design

With more and more people choosing mobile devices as the main platform to get access to the Internet, your website has to go mobile. However, it’s always easier said than done when it comes to optimize your website for desktops and mobile at the same time. This time, Uberflip offered you a comprehensive infographic about this topic.
Our evaluation points
Core Message: 3.5/5
Data Visualization: 3.5/5
Graphic Design: 4/5
Total points: 11/15
5. A Road to Success Using Social Media

There are all kinds of noise around social media these days. When you first get started with social networking, it’s hard to know what works and what doesn’t. Is there any predefined road to social media success?
Read this infographic and find the answer for yourself.
Our evaluation points
Core Message: 3.5/5
Data Visualization: 3.5/5
Graphic Design: 4.5/5
Total points: 11.5/15
Click to see more cool infographics in B2B marketing and technology >>
Like What You See? Click to Share: